#...........................Setting Up...........................
# Load packages
library(tidyverse)
library(scales)
library(ggtext)
library(ggpubr)
library(showtext)
# Load fonts
font_add_google("Playfair", "playfair")
font_add_google("Courier Prime", "courier")
# Load clean data
jra_results <- read_csv(here::here('data', 'jra_clean.csv'),
col_types = cols(race_id_horsenum = 'c', race_id = 'c', finish_time = 'c')) |>
# Convert time character to duration
mutate(finish_time = as.duration(ms(finish_time)))
# Create color palette
colors <- c(
"deepred" = "#A4252A",
"red" = "#E74A22",
"orange" = "#F4BA1F",
"yellow" = "#F8F360",
"blue" = "#4392CE",
"green" = "#52b788",
"tan" = "#F3F2EE")
#.......................Winners List Chart.......................
# Filter original df to AK margins for margins plot
ak_margins <- jra_results |>
filter(race_name == "有馬記念", final_position == 2) |>
select(race_date, horse_name, year, margin_horselen, margin_parsed)
# Compile recent margin data of interest, margins of horses that placed 2nd
ak_margins_recent <- tibble(
race_date = c("2021-12-26", "2022-12-25", "2023-12-24", "2024-12-22", "2025-12-28"),
horse_name = c("ディープボンド", "ボルドグフーシュ", "スターズオンアース", "シャフリヤール", "コスモキュランダ"),
year = c(2021, 2022, 2023, 2024, 2025),
margin_horselen = c("3/4", "2.1/2", "1/2", "ハナ", "1/2"),
margin_parsed = c(0.75, 2.5, 0.5, 0.05, 0.5)
) |>
mutate(race_date = as.Date(race_date))
ak_margins_all <- bind_rows(ak_margins, ak_margins_recent) |>
mutate(n = row_number())
# Filter original df to Arima Kinen & select columns of interest
ak_winners <- jra_results |>
filter(race_name == "有馬記念", final_position == 1) |>
select(race_id, race_date, year, distance_m, horse_num, horse_name, horse_age, finish_time, final_600m_time, win_odds_100Y, win_fav, prize_money_10kY, horse_trainer, horse_owner)
# Compile recent AK winners of interest
ak_winners_recent <- tibble(
race_date = c("2021-12-26", "2022-12-25", "2023-12-24", "2024-12-22", "2025-12-28"),
distance_m = c(2500),
horse_num = c(10, 9, 5, 8, 4),
horse_name = c("エフフォーリア", "イクイノックス", "ドウデュース", "レガレイラ", "ミュージアムマイル"),
horse_age = c(3, 3, 4, 3, 3),
finish_time = c("2:32.0", "2:32.4", "2:30.9", "2:31.8", "2:31.5"),
final_600m_time = c(35.9, 35.4, 34.3, 34.9, 34.6),
win_odds_100Y = c(2.1, 2.3, 5.2, 10.9, 3.8),
win_fav = c(1, 1, 2, 5, 3),
prize_money_10kY = c(30336.0, 40336.0, 50340.2, 50340.2, 50352.8),
year = c(2021, 2022, 2023, 2024, 2025),
horse_trainer = c("鹿戸雄一", "木村哲也", "友道康夫", "木村哲也", "高柳大輔"),
horse_owner = c("キャロットファーム", "シルクレーシング", "キーファーズ", "サンデーレーシング", "サンデーレーシング")
) |>
mutate(
race_date = as.Date(race_date),
finish_time = as.duration(ms(finish_time)))
# Add new rows to outdated data
arima_kinen_all <- bind_rows(ak_winners, ak_winners_recent) |>
mutate(
n = row_number(),
annot = ifelse(n %% 5 == 0 & n != n(), TRUE, FALSE),
avg_speed_m_s = distance_m / as.numeric(finish_time)) |>
# Flip win fav column
mutate(win_fav_rev = abs(win_fav - 16), .after = win_fav)
# Create translation df
ak_names <- tibble(
horse_name = c(
"ダイナガリバー", "メジロデュレン", "オグリキャップ", "イナリワン", "ダイユウサク",
"メジロパーマー", "トウカイテイオー", "ナリタブライアン", "マヤノトップガン", "サクラローレル",
"シルクジャスティス", "グラスワンダー", "テイエムオペラオー", "マンハッタンカフェ", "シンボリクリスエス",
"ゼンノロブロイ", "ハーツクライ", "ディープインパクト", "マツリダゴッホ", "ダイワスカーレット",
"ドリームジャーニー", "ヴィクトワールピサ", "オルフェーヴル", "ゴールドシップ", "ジェンティルドンナ",
"ゴールドアクター", "サトノダイヤモンド", "キタサンブラック", "ブラストワンピース", "リスグラシュー",
"クロノジェネシス", "エフフォーリア", "イクイノックス", "ドウデュース", "レガレイラ",
"ミュージアムマイル"
),
horse_name_eng = c(
"Dyna Gulliver", "Mejiro Durren", "Oguri Cap", "Inari One", "Daiyu Saku",
"Mejiro Palmer", "Tokai Teio", "Narita Brian", "Mayano Top Gun", "Sakura Laurel",
"Silk Justice", "Grass Wonder", "T M Opera O", "Manhattan Cafe", "Symboli Kris S",
"Zenno Rob Roy", "Hearts Cry", "Deep Impact", "Matsurida Gogh", "Daiwa Scarlet",
"Dream Journey", "Victoire Pisa", "Orfevre", "Gold Ship", "Gentildonna",
"Gold Actor", "Satono Diamond", "Kitasan Black", "Blast Onepiece", "Lys Gracieux",
"Chrono Genesis", "Efforia", "Equinox", "Do Deuce", "Regaleira",
"Museum Mile"
)
)
# Join on arima kinen df
arima_kinen_all <- left_join(arima_kinen_all, ak_names, by = 'horse_name') |>
relocate(horse_name_eng, .after = horse_name)
# Create prize money label column
arima_kinen_all <- arima_kinen_all |>
mutate(prize_money_label = round(prize_money_10kY / 100, 1), .after = prize_money_10kY)
# Create repeat winners columns
arima_kinen_all <- arima_kinen_all |>
group_by(horse_name_eng) |>
mutate(win_count = n()) |>
# Bold repeat winners
mutate(repeat_win_label = ifelse(win_count > 1, paste0("**", horse_name_eng, "**"), horse_name_eng))
winners_plot <- ggplot(arima_kinen_all) +
# Dotted gridlines
geom_segment(aes(x = 0, xend = 20000, y = n, yend = n), linetype = 'dotted', linewidth = 0.2) +
# Year list
geom_text(aes(x = -1000, y = n, label = year), family = 'courier', size = 4) +
# Winners list
geom_richtext(aes(x = 3000, y = n, label = repeat_win_label), fill = colors[['tan']], label.size = 0, label.padding = unit(0.1, "lines"), family = 'playfair', size = 5) +
# Margin plot
geom_segment(data = ak_margins_all, aes(x = 8000 - margin_parsed * 150, xend = 8000 + margin_parsed * 150, y = n, yend = n), linewidth = 3) +
# Popular rank plot
geom_segment(aes(x = 10000, xend = 10000 + win_fav_rev * 250, y = n, yend = n), linewidth = 2, color = colors[['orange']], alpha = 0.6) +
# Prize money plot
geom_ribbon(aes(xmin = 14000, xmax = 14000 + prize_money_10kY * 0.115, y = n), orientation = 'y', position = 'identity', fill = colors[['red']], alpha = 0.6) +
geom_point(data = subset(arima_kinen_all, annot), aes(x = 14000 + prize_money_10kY * 0.115, y = n), size = 1) +
geom_richtext(data = subset(arima_kinen_all, annot), aes(x = 14000 + prize_money_10kY * 0.115 + 400, y = n, label = prize_money_label), fill = colors[['tan']], hjust = 0, label.size = 0, label.padding = unit(0.1, "lines"), family = 'courier', size = 3) +
# Column titles
annotate("text", x = c(-1000, 3000, 8000, 12000, 17000), y = -2, label = c("Year", "Winner", "Winning\nMargin Size", "Favorite-to-Win", "Prize Money"), size = 4.5, family = 'playfair', lineheight = 0.7) +
# Vertical lines
annotate("segment", x = c(-2000, 0, 6000, 10000, 14000, 20000), xend = c(-2000, 0, 6000, 10000, 14000, 20000), y = -3, yend = 41, linewidth = 0.3) +
# Horizontal lines
annotate("segment", x = -2000, xend = 20000, y = c(-3, -1, 41), yend = c(-3, -1, 41), linewidth = 0.3) +
# Column unit labels
annotate("text", x = c(10500, 13500), y = 0, label = c("Least", "Most"), hjust = c(0, 1), size = 3) +
annotate("text", x = c(14500, 19500), y = 0, label = c("0", "¥500M"), hjust = c(0, 1), size = 3) +
labs(title = "Arima Kinen Winners", caption = "Repeat Winners") +
scale_y_reverse(expand = expansion(mult = 0.0001)) +
theme_void() +
theme(
plot.background = element_rect(fill = "#F3F2EE", color = NA),
plot.margin = margin(10, 10, 10, 10),
plot.title = element_text(family = 'playfair', size = 32, margin = margin(0, 0, 5, 10)),
plot.caption = element_text(face = 'bold', family = 'playfair')
)
#......................Winning Times Chart.......................
# Filter to non-AK winners on the same track & distance
non_ak_winners <- jra_results |>
filter(race_name != "有馬記念", distance_m == 2500, racetrack_name == '中山', final_position == 1, track_surface == "芝") |>
group_by(race_name) |>
mutate(race_count = n()) |>
filter(race_count >= 25)
# Aggregate non-AK winners
non_ak_yearly <- non_ak_winners |>
group_by(year) |>
summarise(avg_win_time = mean(finish_time))
winning_times_plot <- ggplot() +
geom_line(data = non_ak_yearly, aes(year, avg_win_time, color = 'Other Races')) +
geom_point(data = non_ak_yearly, aes(year, avg_win_time), color = 'grey59', size = 2) +
geom_line(data = arima_kinen_all, aes(year, finish_time, color = 'Arima Kinen')) +
geom_point(data = arima_kinen_all, aes(year, finish_time), color = colors[['deepred']], size = 2) +
scale_color_manual(values = c("Other Races" = 'grey59', "Arima Kinen" = colors[['deepred']])) +
annotate('richtext', x = 1997, y = 149.5, label = 'Current Record Holder:<br><b>Zenno Rob Roy (2:29.5)', label.size = 0, family = 'courier', fill = colors[['tan']]) +
labs(x = "Year", y = "Finish Time (seconds)", title = "Arima Kinen Win Times: Faster Than the Rest", subtitle = "AK winners finish faster than other race winners on the same track & distance.") +
scale_x_continuous(breaks = seq(1985, 2025, by = 5), labels = seq(1985, 2025, by = 5)) +
theme_classic(base_family = 'courier', base_size = 14) +
theme(
panel.grid.major.y = element_line(color = 'grey59', linewidth = 0.5, linetype = 'dotted'),
panel.background = element_rect(fill = "#F3F2EE", color = NA),
plot.background = element_rect(fill = "#F3F2EE", color = NA),
plot.title = element_markdown(family = 'playfair', size = 28),
plot.title.position = 'plot',
plot.subtitle = element_text(size = 12),
legend.title = element_blank(),
legend.position = 'top',
legend.background = element_rect(fill = colors[['tan']], color = NA)
)
#........................Prize Money Chart.......................
# Create df for recent data, winners of different G1 races & 1st place prize
prize_g1_recent <- tribble(
~year, ~race_name, ~prize_money_10kY,
2021, "東京優駿", 22718.8,
2021, "有馬記念", 30336,
2021, "宝塚記念", 15281.4,
2021, "安田記念", 13298.2,
2022, "東京優駿", 22697.8,
2022, "有馬記念", 40336,
2022, "宝塚記念", 20378,
2022, "安田記念", 18382.2,
2023, "東京優駿", 32734.9,
2023, "有馬記念", 50340.2,
2023, "宝塚記念", 22369.6,
2023, "安田記念", 18378,
2024, "東京優駿", 32886.8,
2024, "有馬記念", 50340.2,
2024, "宝塚記念", 22273,
2024, "安田記念", 18378,
2025, "東京優駿", 32771.3,
2025, "有馬記念", 50352.8,
2025, "宝塚記念", 30361.2,
2025, "安田記念", 18382.2,
)
# Filter to races of interest
prize_g1 <- jra_results |>
filter(race_grade == "G1", race_name %in% c("有馬記念", "宝塚記念", "東京優駿", "安田記念"), final_position == 1, year != 2021) |>
select(year, race_name, prize_money_10kY)
# Combine recent & original data
prize_g1_all <- bind_rows(prize_g1, prize_g1_recent)
# Translate race names
race_names_translate <- tibble(
race_name = c("有馬記念", "宝塚記念", "東京優駿", "安田記念"),
race_name_eng = c("Arima Kinen", "Takarazuka Kinen", "Tokyo Yushun", "Yasuda Kinen")
)
# Join translated names
prize_g1_all <- left_join(prize_g1_all, race_names_translate, by = 'race_name')
prize_plot <- ggplot(prize_g1_all) +
geom_line(aes(x = year, y = prize_money_10kY, group = race_name_eng, color = race_name_eng), linewidth = 1.5) +
labs(x = "Year", y = "Prize Money", title = "Arima Kinen Winning Prize", subtitle = "Compared to other G1 races, the AK holds the largest prize pool.") +
scale_y_continuous(labels = label_currency(prefix = "¥", suffix = "M", scale = 1/100)) +
scale_color_manual(values = c(colors[['deepred']], colors[['green']], colors[['blue']], colors[['orange']])) +
scale_x_continuous(breaks = seq(1990, 2025, by = 5)) +
theme_classic(base_family = 'courier', base_size = 13) +
theme(
panel.grid.major.y = element_line(color = 'grey59', linewidth = 0.5, linetype = 'dotted'),
panel.background = element_rect(fill = colors[['tan']], color = NA),
plot.background = element_rect(fill = colors[['tan']], color = NA),
plot.title = element_text(family = 'playfair', size = 28),
plot.title.position = 'plot',
legend.title = element_blank(),
legend.background = element_rect(fill = colors[['tan']], color = NA),
legend.position = 'top')
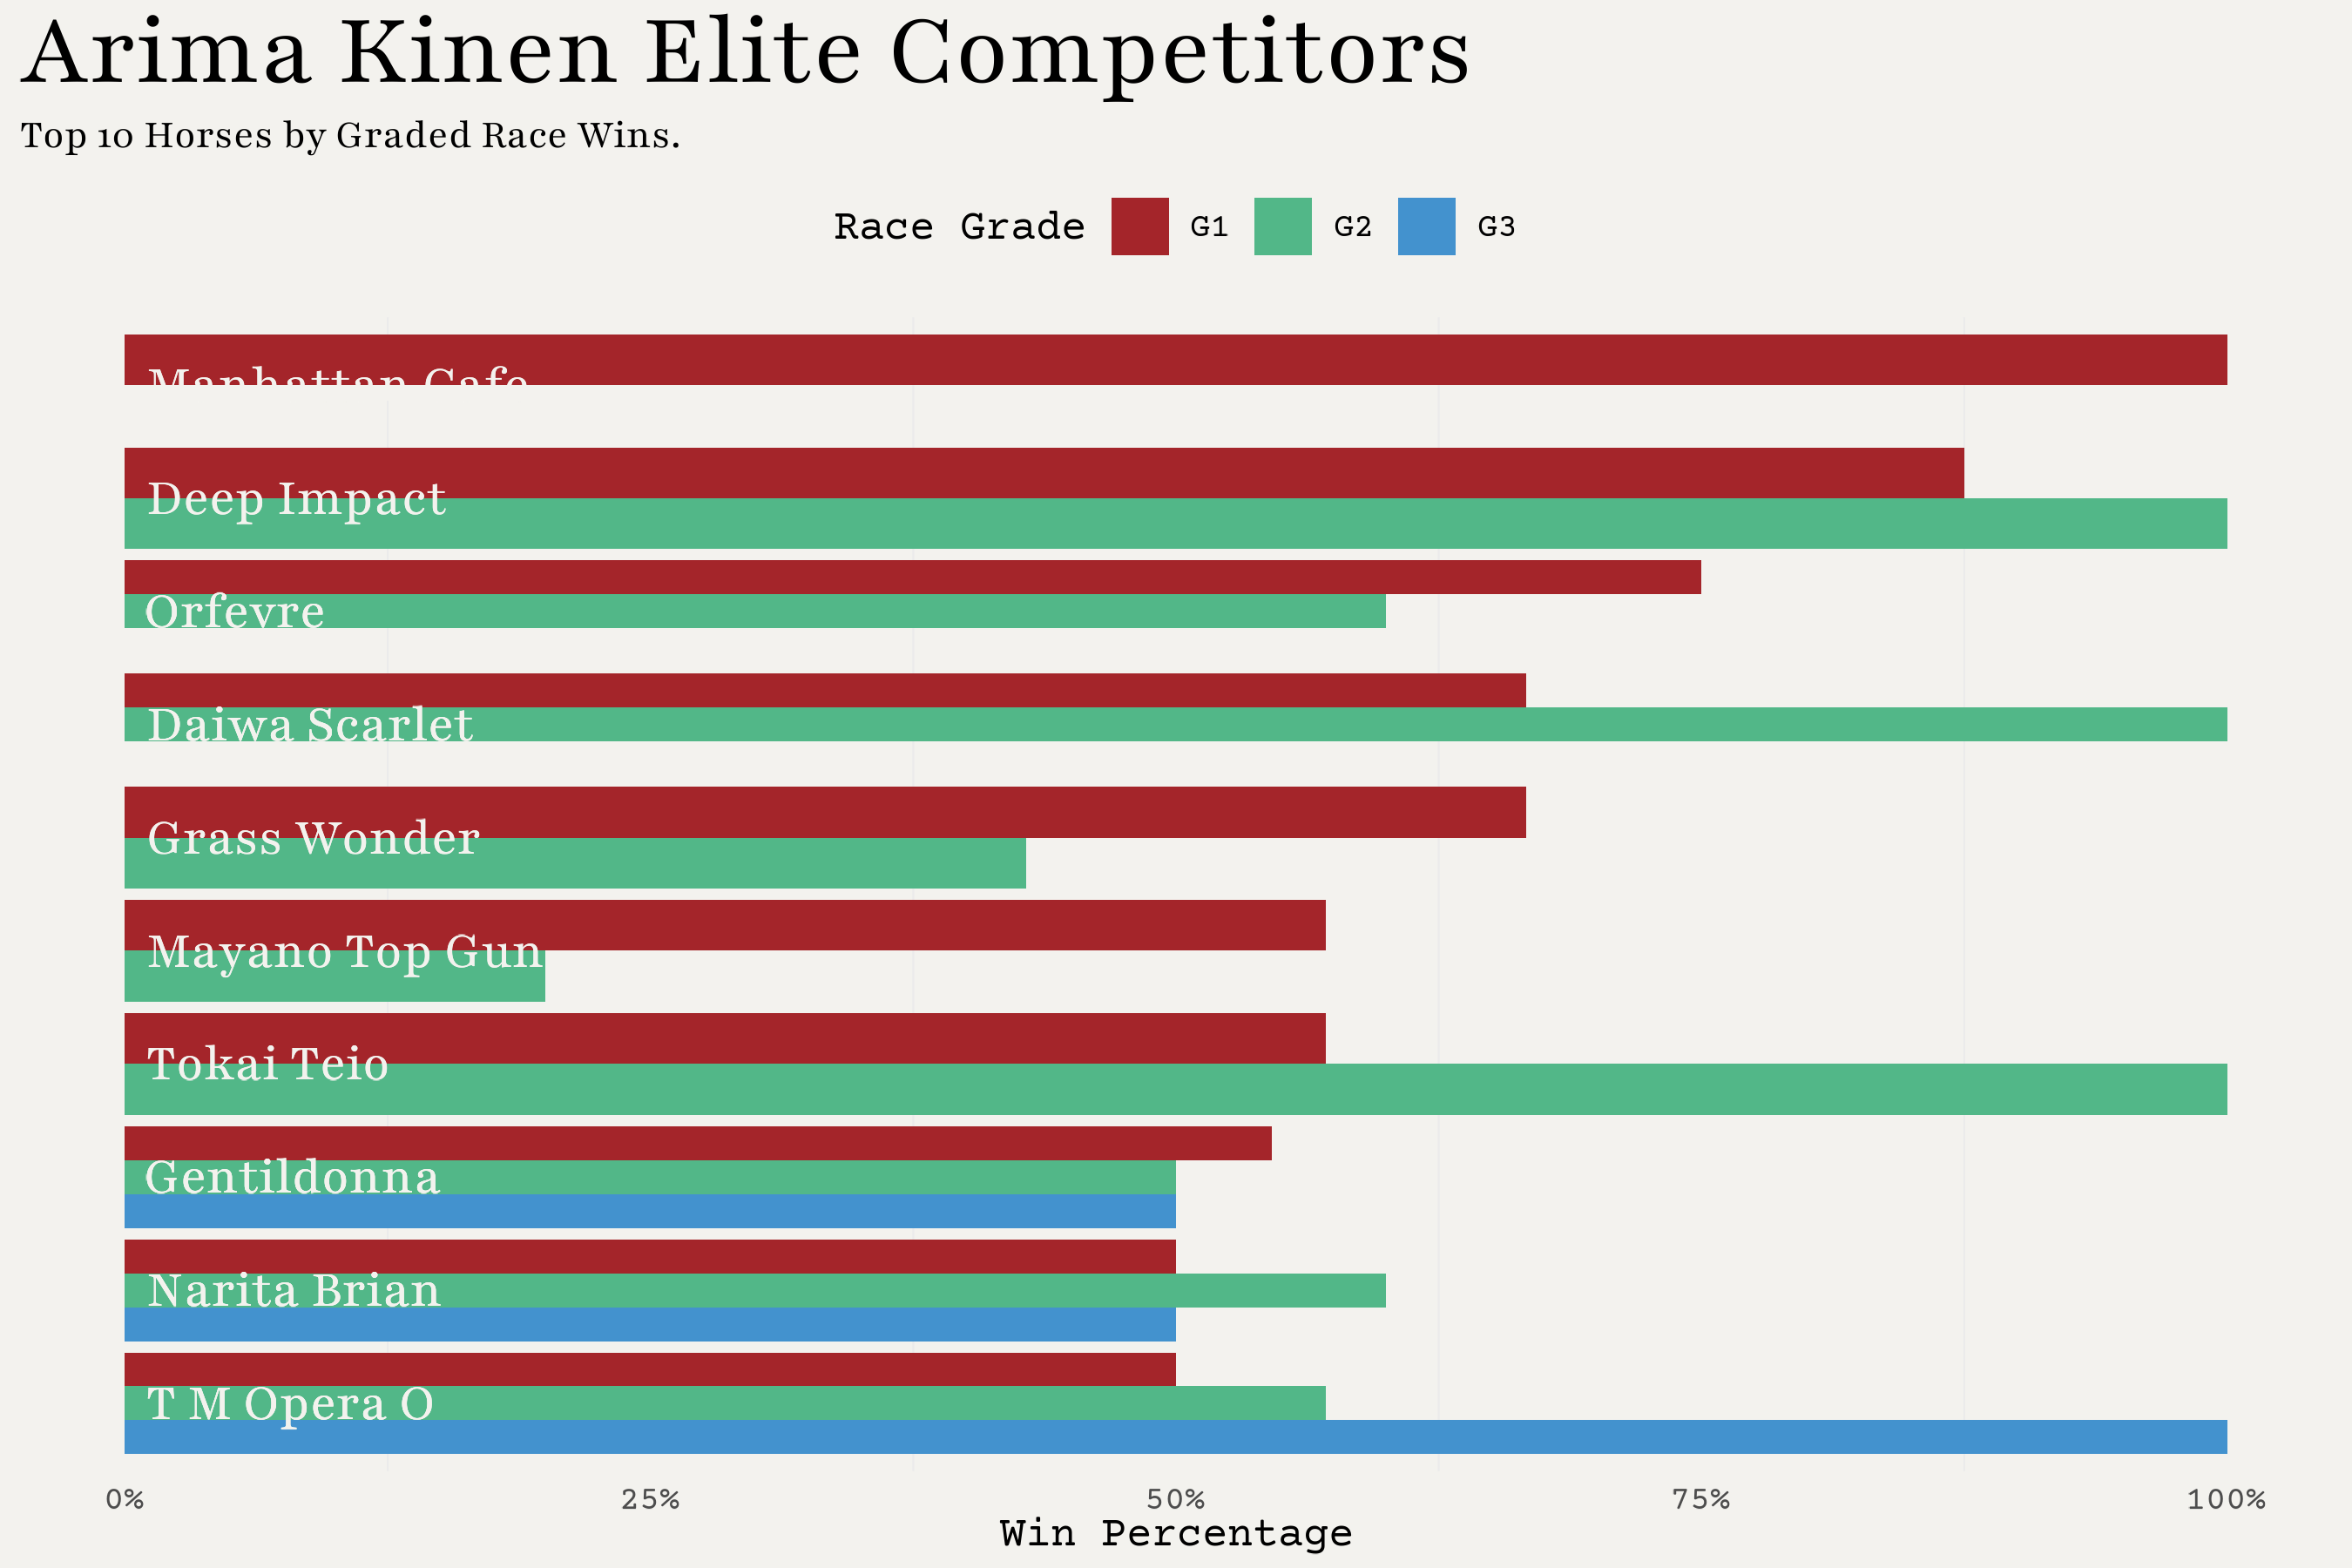
#......................Top 10 Winners Chart......................
# Filter to horses that won AK
ak_champs <- jra_results |>
filter(horse_name %in% ak_names$horse_name, race_grade %in% c("G1", "G2", "G3")) |>
# Calculate career wins
group_by(horse_name, race_grade) |>
summarise(grade_win_count = sum(final_position == 1, na.rm = TRUE), n_races = n(), grade_winpct = grade_win_count / n_races) |>
left_join(ak_names)
# Arrange horses by win percentage descending
champ_order <- ak_champs |>
group_by(horse_name_eng) |>
filter(race_grade == "G1") |>
arrange(grade_winpct) |>
pull(horse_name_eng)
ak_elite <- ak_champs |>
filter(horse_name_eng %in% tail(champ_order, 10)) |>
ggplot(aes(grade_winpct, factor(horse_name_eng, levels = champ_order), fill = race_grade)) +
geom_col(position = position_dodge(reverse = TRUE)) +
geom_text(aes(label = horse_name_eng, x = 0.01), hjust = 0, size = 5, color = colors[['tan']], family = 'playfair') +
labs(x = "Win Percentage", fill = "Race Grade", title = 'Arima Kinen Elite Competitors', subtitle = 'Top 10 Horses by Graded Race Wins.') +
scale_fill_manual(values = c(colors[['deepred']], colors[['green']], colors[['blue']])) +
scale_x_continuous(labels = label_percent()) +
theme_minimal(base_family = 'courier') +
theme(
plot.title = element_text(family = 'playfair', size = 28),
plot.subtitle = element_text(family = 'playfair'),
axis.title.y = element_blank(),
axis.text.y = element_blank(),
legend.position = 'top',
panel.grid.major = element_blank(),
panel.background = element_rect(fill = colors[['tan']], color = NA),
plot.background = element_rect(fill = colors[['tan']], color = NA),
legend.background = element_rect(fill = colors[['tan']], color = NA)
)